Radiography Image Quality and Efficiency Metrics in an Automated Software
September 05, 2024
Metrics to monitor quality and efficiency include exposure index, deviation index, and rejection rates. Exposure index and deviation index help guide the selection of exposure parameters required to produce optimal images, while the monitoring of reject rates is considered integral to quality control (QC) programs by various national and international organizations including the American College of Radiology (ACR) [1], American Association of Physicists in Medicine (AAPM) [2-4], National Council on Radiation Protection (NCRP) [5], and Royal College of Radiologists (RCR) [6].
Exposure index (EI) and deviation index (DI) are indicators of image quality. Exposure index is the measure of the amount of exposure received by the image receptor, derived from the mean pixel value of the image. Vendors define their exposure indicators using different names, units, exposure dependencies, and detector calibration conditions [7]. A standardized exposure index was defined by the International Electrotechnical Commission (IEC) [8] and American Association of Physicists in Medicine (AAPM) task group 116 [9], that is proportional to the air kerma received by the detector under defined standard beam conditions for the same raw pixel value in the relevant image region.
Deviation index is calculated using the following formula:
DI = 10log (EI/EIT)
Where EIT is the target exposure index defined by users for each specific detector and patient- and anatomy-specific exam. A DI of 0 indicates appropriate detector exposure, while negative values indicate underexposure and positive values indicate overexposure. Specifically, DI values of +1 and -1 indicate an overexposure of 25% and underexposure of 20% respectively, compared to the target exposure to the detector, while DI values of +3 and −3 indicate exposures that are 2 times more and less than the target exposure, respectively [7]. Recommendations have been made to repeat images for DI>3 only if relevant anatomy has been clipped, consult a radiologist for DI range of 1-3, and repeat images with DI<-3 [9].
While repeated and rejected images are essential to clinical practice, they also contribute to unnecessary patient radiation exposure and inefficient resource use. The most common rejection reason has been widely recognized as patient positioning, as well as incorrect technique, image artifacts, patient motion, equipment issues, incorrect protocol, among others [10-14].
Reject rate (RR) is calculated using a simple formula of the number of rejected images divided by the total number of images taken, defined by the number of exposure button presses. Reject rate targets have been suggested as follows:
- 5% – 7% suggested by the Conference of Radiation Control Program Directors (CRCPD) [15]
- 8% target, with 10% as the upper threshold and 5% as the lower threshold for investigation suggested in AAPM Report 151
- 5% target for pediatric clinics, with 7% as the upper threshold for investigation [3]
- 2-5% Royal College of Radiology (UK) [6]
Recent studies cite reject rates ranging between 1.2 and 17%, with an average RR of 10% [16-31], matching the upper threshold proposed by AAPM.
Various radiography image quality and efficiency metrics including rejection rate, exposure index & deviation index are combined in Qaelum’s Radiography Quality Insights software. Key performance indicators (KPIs) such as the clinically relevant rejection rate for images with a DI>3 and DI<-3 (Figure 1), volumes of accepted and rejected images, over- and under-exposed image volumes, among others, can be tracked.
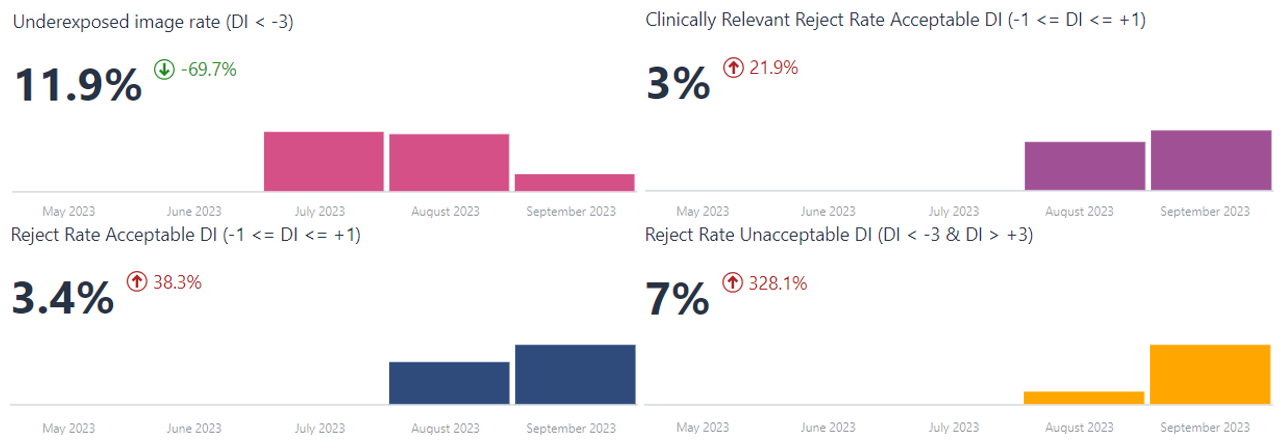
Figure 1. Key performance indicators (KPIs) such as the clinically relevant rejection rate for images with acceptable and unacceptable deviation indices of all ranges.
The hour/weekday analysis for a selection of parameters like RR, clinically relevant RR, DAP & EI can be used to determine deviations during specific shifts. For example, shifts with low study volumes (proportional to size of circle or square, Figure 2) and reject rates far exceeding the expected value of ~ 4% observed during normal working hours, as seen on Saturday at 21 h (RR>24%).
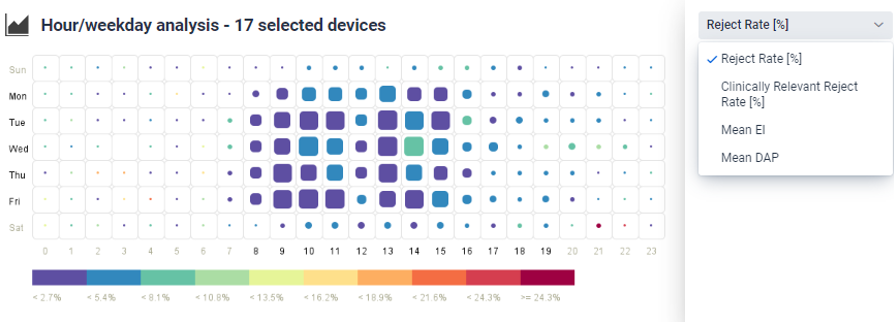
Figure 2. Difference in metrics including reject rate, clinically relevant reject rate, mean EI and DAP can be monitored to evaluate any differences between shifts e.g. low study volumes (proportional to size of circle or square) and metrics like reject rate far exceeding the expected value, as shown on Saturday at 21 h.
Standardized reject reasons can be selected as defined in the AAPM TG 151 and 305 reports, including the broad and detailed categories, and whether the rejection reason is considered clinically relevant (Figure 3). Images that do not result in dose to the patient e.g. quality control images, can be excluded. A study by Rosenkrantz et al. [32] found that 77.9% of rejected musculoskeletal radiographs and 93.1% of rejected chest radiographs provided sufficient diagnostic information, and so did not actually need to be rejected. Reject verification can be performed to identify and document reject reasons, where radiologists and technologists can review images together for technologists to better understand the expected image quality criteria and minimize unnecessary rejections [4].
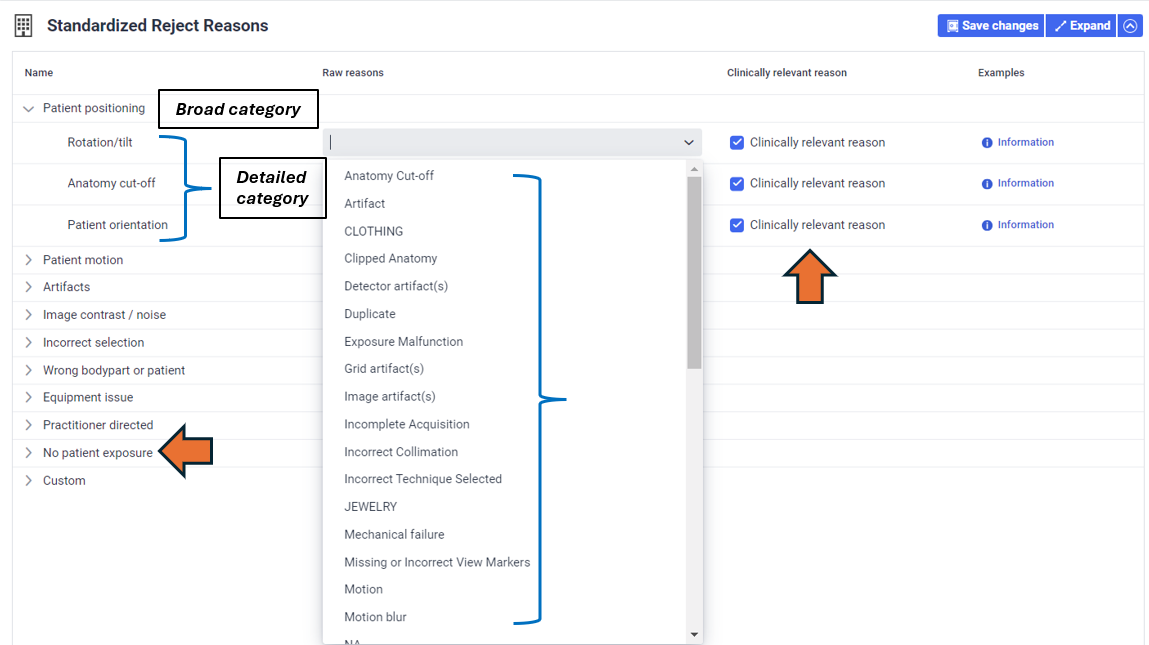
Figure 3. Standardized reject reasons can be selected as defined in the AAPM TG 151 report, including the broad and detailed categories, and whether the rejection reason is considered to be clinically relevant.
In addition to assessing reject rates per rejection reason the Serra et al. group [16] also evaluated reject rates by body part and room type, finding RR variation in room types i.e. emergency, inpatient and outpatient and outpatient only, as well as higher RRs for chest and knee body parts, underscoring the need to perform RR analysis in a more specific manner. A study by Alashban et al. [22] found statistically significant differences in RRs between techs, attributing them to variations in experience and training. AAPM TG 305 encourages monitoring tech-specific RRs, creating targeted education and setting personal performance improvement goals based on the results [4].
Various customizations are possible in the software to monitor reject rates by anatomical region, room, technologist, among others, all within the same chart. Figure 4 shows the evaluation of rejected image volume grouped by deviation index status. The user can then click on under- or overexposed images to view the breakdown of these by body part, and then evaluate the volume of these rejected images further by technologist. Such evaluations can help determine technologists and/or specific body part imaging requiring additional training, or devices that may benefit most from optimization.
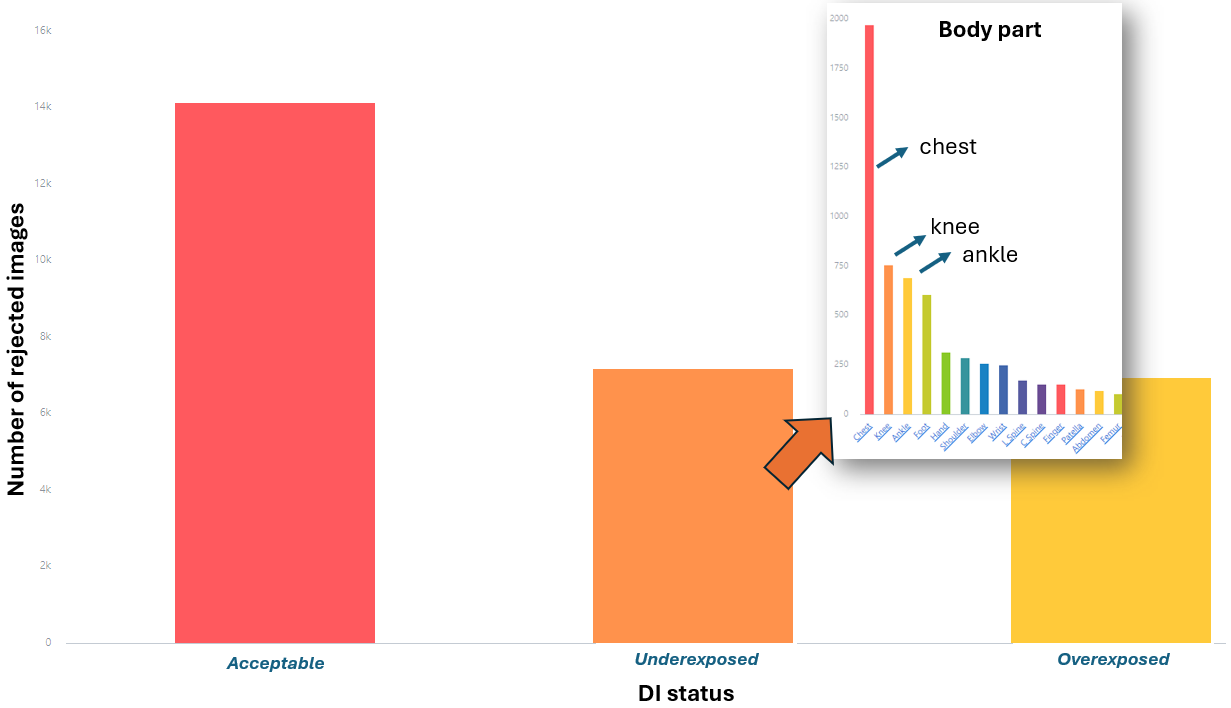
Figure 4. Example of possible chart customization to evaluate rejected image volumes by deviation index status. The user can then click on under- or overexposed images to view the breakdown of these by body part, and then evaluate the volume of these images further by technologist.
If you would like to know more about the Radiography Quality Insights software by Qaelum visit https://qaelum.com/solutions/radiography-quality-insights or send an email to
References:
[1] American College of Radiology. ACR technical standard for diagnostic medical physics performance monitoring of radiographic and fluoroscopic equipment. Reston: ACR, 2006; 1139-1142.
[2] AAPM report No. 74, Quality Control in Diagnostic Radiology; 2002.
[3] Jones AK, Heintz P, Geiser W, et al. Ongoing quality control in digital radiography: report of AAPM Imaging Physics Committee Task Group 151.Med Phys. 2015;42(11):6658-6670. doi:10.1118/1.4932623
[4] Little K,Reiser I, Apgar B, et al. AAPM task group report 305: Guidance for standardization of vendor-neutral reject analysis in radiography. J Appl Clin Med Phys. 2023;24:e13938.
[5] NCRP Quality Assurance for Diagnostic Imaging. Report 99 Bethesda, MD: National Council on Radiation Protection and Measurements; 1988.
[6] Image rejection analysis in digital radiography [QSI REFS: XR-503, XR-514] (2024) Image rejection analysis in digital radiography [QSI Refs: XR-503, XR-514] | The Royal College of Radiologists. Available at: https://www.rcr.ac.uk/career-development/audit-quality-improvement/auditlive-radiology/image-rejection-analysis-in-digital-radiography-qsi-refs-xr-503-xr-514/ (Accessed: 08 August 2024).
[7] Seibert JA, Morin RL. The standardized exposure index for digital radiography: an opportunity for optimization of radiation dose to the pediatric population. Pediatr Radiol. 2011 May;41(5):573-81.
[8] International Electrotechnical Commission. Medical electrical equipment–Exposure index of digital X-ray imaging systems-Part 1: Definitions and requirements for general radiography. IEC, Geneva, Switzerland. 2008:62494-1.
[9] AAPM report No. 116, Quality Control in Diagnostic Radiology; 2009.
[10] Andersen ER, Jorde J,Taoussi N,Yaqoob SH,Konst B,Seierstad T. Reject analysis in direct digital radiography. Acta Radiol. 2012;53(2):174-178. doi:10.1258/ar.2011.110350
[11] Midgley SM. Capture and analysis of radiation dose reports for radiology. Australas Phys Eng Sci Med. 2014;37(4):805-819. doi:10.1007/s13246-014-0304-7
[12] Fintelmann F, Pulli B, Abedi-Tari F, et al. Repeat rates in digital chest radiography and strategies for improvement. J Thorac Imaging. 2012;27(3):148-151. doi:10.1097/RTI.0b013e3182455f36
[13] Waaler D, Hofmann B. Image rejects/retakes–radiographic challenges. Radiat Prot Dosimetry. 2010;139(1-3):375-379. doi:10.1093/rpd/ncq032
[14] Hofmann B,Rosanowsky TB, Jensen C,Wah KHC.Image rejects in general direct digital radiography. Acta Radiologica Open. 2015;4(10):205846011560433. doi:10.1177/2058460115604339
[15] Conference of Radiation Control Program Directors. Quality control recommendations for diagnostic radiography. Conference of Radiation Control Program Directors (CRCPD); 2001.
[16] Serra, D., Neep, M.J. and Ryan, E. (2024), Multi-centre digital radiography reject analysis for different clinical room use types: The establishment of local reject reference levels for public hospital departments. J Med Radiat Sci. https://doi.org/10.1002/jmrs.796
[17] Atkinson S, Neep M, Starkey D. Reject rate analysis in digital radiography: an Australian emergency imaging department case study. J Med Radiat Sci 2020; 67: 72–9.
[18] Stephenson-Smith B, Neep MJ, Rowntree P. Digital radiography reject analysis of examinations with multiple rejects: an Australian emergency imaging department clinical audit. J Med Radiat Sci 2021; 68: 245–52.
[19] Bantas G, Sweeney RJ, Mdletshe S. Digital radiography reject analysis: A comparison between two radiology departments in New Zealand. J Med Radiat Sci 2023; 70:137–44.
[20] Haddad L, Saleme H, Howarth N, Tack D. Reject analysis in digital radiography and computed tomography: a belgian imaging department case study. J Belgian Soc Radiol 2023; 107:100.
[21] Otayni A, Aftan AA, Nammazi J, et al. Assessment of Rejected Radiographs during planar imaging procedures. J Radiat Res Appl Sci 2023; 16: 100556.
[22] Alashban Y, Shubayr N, Alghamdi AA, Alghamdi SA, Boughattas S. An assessment of image reject rates for digital radiography in Saudi Arabia: A cross-sectional study. J Radiat Res Appl Sci 2022; 15(1): 219–23.
[23] Ali A, Yaseen M. Digital radiograph rejection analysis during “Coronavirus disease 2019 (COVID-19) pandemic” in a tertiary care public sector hospital in Khyber Pakhtunkhwa Province of Pakistan. Chin J Acad Radiol 2021; 4: 133–40.
[24] Jastaniyyah DF, Jawhari AA, Mugharbel AT, Khafaji MA, Albahiti SH. How has the COVID-19 pandemic affect the rejection rates and repeat reasoning of digital radiography? Saudi Med J 2021; 42: 1041–4.
[25] Alyousef KA, Alkahtani S, Alessa R, Alruweili H. Radiograph reject analysis in a large tertiary care hospital in Riyadh, Saudi Arabia. Global J Qual Saf Healthc 2019; 2: 30–3.
[26] Alahmadi O, Alrehaili A, Gameraddin MB. Evaluation of reject analysis of chest radiographs in diagnostic radiology. Am J Diagn Imag 2019; 5:4.
[27] Yurt A, Tintas M, Y¨ uksel R. Reject analysis in digital radiography: a prospective study. Int J Anat Radiol Surg 2018; 7: e4.
[28] Hofmann B, Rosanowsky TB, Jensen C, Wah KH. Image rejects in general direct digital radiography. Acta Radiol Open 2015; 4: 2058460115604339.
[29] Taylor N. The art of rejection: Comparative analysis between Computed Radiography (CR) and Digital Radiography (DR) workstations in the Accident & Emergency and General radiology departments at a district general hospital using customised and standardised reject criteria over a three year period. Radiography 2015; 21: 236–41.
[30] Khafaji MA, Hagi SK. Direct digital radiograph. Technicians role in obtaining good images. Saudi Med J 2014; 35: 879–81.
[31] Andersen ER, Jorde J, Taoussi N, Yaqoob SH, Konst B, Seierstad T. Reject analysis in direct digital radiography. Acta Radiol 2012; 53: 174–8.
[32] Rosenkrantz AB, Jacobs JE, Jain N, et al. Technologist-directed repeat musculoskeletal and chest radiographs:how often do they impact diagnosis? Am J Roentgenol. 2017;209(6):1297-1301. doi:10.2214/AJR.17.18030
Authors:
Anna Romanyukha received her Ph.D. degree in medical physics from the Centre of Medical Radiation Physics (UOW, Australia) and her M.Sc. degree in health physics from Georgetown University (Washington DC, USA). She worked as a post baccalaureate and pre doctoral fellow at the National Cancer Institute (NIH, Washington DC) on various projects including radiation dose estimation from diagnostic exposures. She now works in Qaelum NV, focusing on advanced software tools in patient radiation dose management and quality.
Niki Fitousi, PhD, is a certified medical physicist with professional experience in all fields of Medical Physics (Radiation Therapy, Diagnostic Radiology, Nuclear Medicine, Radiation Protection). She is currently the Head of Research and Applications in Qaelum, focusing mostly in the fields of radiation dose management, quality and efficiency in medical imaging. She is also a member of the Medical Physics World Board of the International Organization for Medical Physics.


