A vendor-neutral solution to:
- Automatically collect all MRI study information and convert it into a vendor-neutral data model
- Analyze and understand how MRI devices are being utilized
- Optimize scheduling and simulate different utilization scenarios, including coil usage
- Empower optimization studies with relevant and searchable data
- Highlight quality issues caused by wrong settings or suboptimal procedures
MRI Efficiency is an integral part of our efficiency management tools, including CT repeat and Contrast Management.
What is MRI Efficiency by Qaelum?
The MRI Efficiency module of the FOQAL platform collects images and metadata of the performed MR exams. It analyzes this data and creates a vendor-neutral data model, allowing in-depth analyses of MRI device utilization. In addition to identifying gaps in MRI device usage, the software analyzes trends through automated KPI monitoring, advanced statistics, distribution graphs, and benchmarks. Insights on the usage of similar protocols are generated automatically, and cases where extra training may be beneficial are highlighted. Integration is flawless with any PACS or directly with MRI scanners using industry standards. All analyses are performed in the background requiring minimal to no supervision.
Why MRI Efficiency by Qaelum?
Magnetic Resonance Imaging (MRI) services have seen a steady increase in usage from the inpatient, outpatient and Emergency Department populations. With increased demand for MRI services, operational details like staff and patient scheduling, service turn-around-times, and throughput have become more challenging. Managing and analyzing MRI data is a complex and time-consuming task that becomes even more difficult when with different manufacturers and generations of scanners. The MRI Efficiency solution solves this problem and provides actionable numbers to support decisions to improve efficiency and quality. In addition to built-in Key Performance Indicators (KPIs), the user can define their own customized regions of interest. The configurable interface allows to focus on the relevant KPIs for your facility without being overwhelmed by numerous charts and numbers.
What can I achieve with the MRI Efficiency management module?
- Gain a better understanding of how MRI scanners are being utilized and improve the planning of future studies and operating hours
- Assess the time needed to prepare a patient for a specific protocol, run the protocol, as well as the idle time between different sequences, all evaluated by the Active Imaging Ratio KPI
- Estimate the financial liabilities of studies that utilize more scanner time than expected or needed
- Monitor and compare protocol usage between different scanners
- Track the usage of different coils and use this information to make informed decisions on new coils and their optimal ROIs (returns on investment)
- Flag bad practices in terms of settings or used coils
- Analyze differences in the execution of similar protocols on different scanners or locations in terms of sequences, used coils, machine settings, and exam times
- Evaluate the preparation time required for specific protocols, leading to optimization of the Active Imaging Ratio, for example by introducing a preparation room
Key Performance Indicators – KPIs
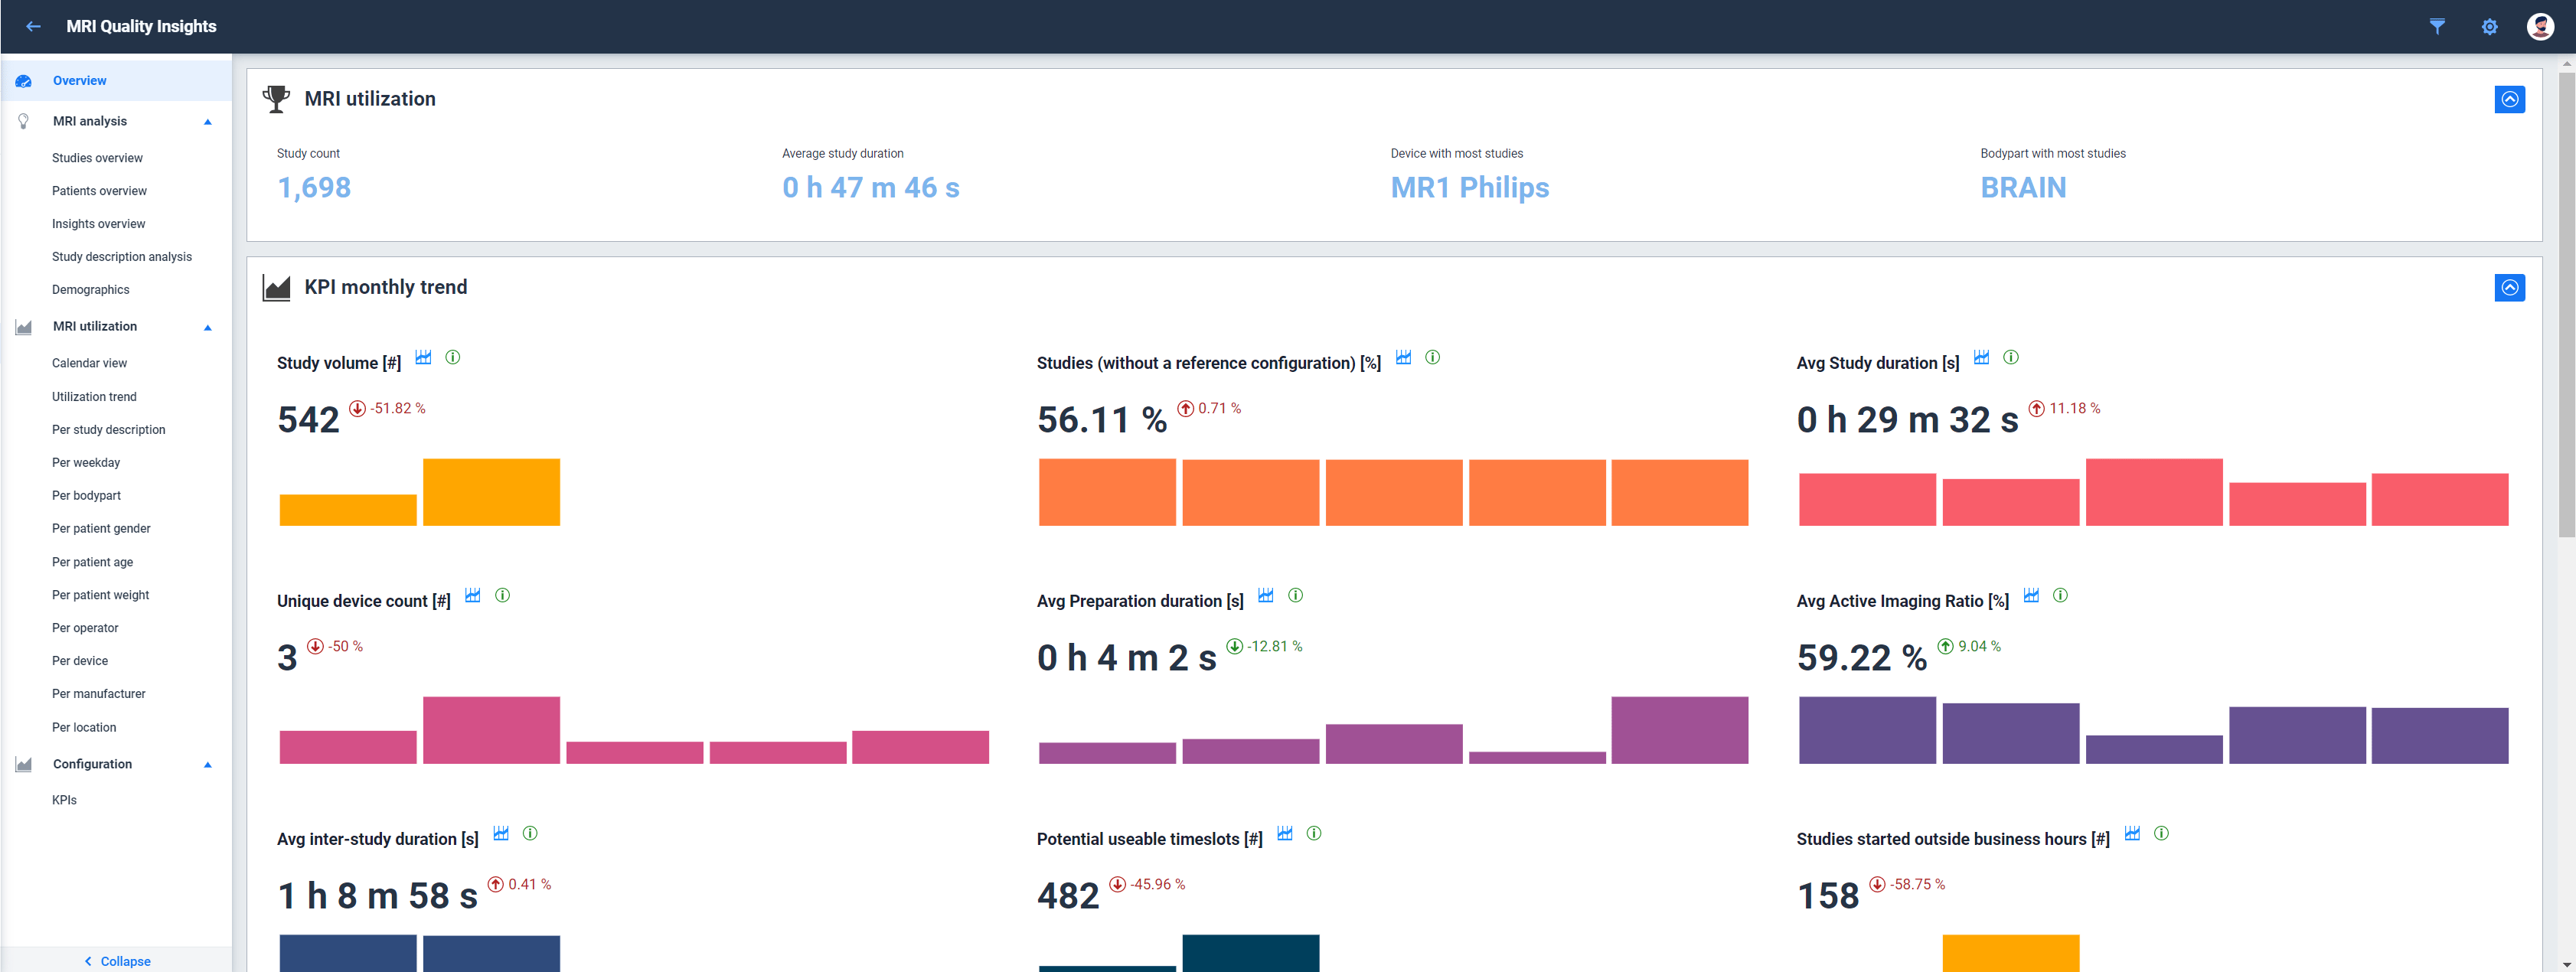
Performance metrics are calculated and monitored continuously based on live device data.
- Metrics like specific energy dose(SED) and specific absorption rates(SAR) are monitored to facilitate training and optimization
- KPIs forstudy duration, preparation time, study composition, inter-sequence duration, and many more are customizable and available directly on the overview page
- Device utilization metrics to track occupancy rates such as the active imaging ratio and automatic calculation of potential usable exam slots, allowing more patients to be imaged without requiring extra time
Trends
Various trend charts are automatically compiled for users to quickly spot outliers, changes in normal behavior, and any potential patient safety concerns.
- Technologist performance trends can be fully monitored by the number of studies, study duration and preparation, study composition, and average specific energy dose per technologist to ensure optimal workload distribution and workflow efficiency
- Device usage trends are displayed per day or over time to quickly spot devices with excessive idle time, differences in device usage, and outliers in device workload over time
- Trend comparisons are offered by location type, allowing to compare MRI metrics between different facilty types, like academic vs private clinics or main vs satellite centers
Optimization
- Study insights are automatically generated based on the collected data and guide users to potential optimization strategies, including protocol inhomogeneity between MR devices and repeated sequences in standard protocols
- Improvements can be created directly from the data, and allow user assignment, progress tracking, and attachment of accompanying documents


